What is a Confidence Interval and How Do You Calculate it?
Confidence interval is a range of values derived from a statistical analysis. It contains the actual value of an unknown population parameter that gives some degree of confidence. For instance, if you were to repeat a given survey several times, you expect the true population to fall within the calculated confidence interval a given percentage of the time.
Elevate Your Writing with Our Free Writing Tools!
Did you know that we provide a free essay and speech generator, plagiarism checker, summarizer, paraphraser, and other writing tools for free?
Access Free Writing ToolsMost students struggle producing quality statistics solutions since they find statistics to be a challenging and overwhelming subject. However, that should not be a reason to get poor grades. Gudwriter offers professional statistics homework help services aimed at assisting students excel in their statistics coursework. We have a pool of experienced tutors equipped with the knowledge to aid you understand any statistical concepts either simple or complex. Don’t let statistics hold you back from achieving your academic goals. Contact us today and begin the journey to achieving your academic goals.
Most analysts will use confidence intervals with either 99% or 95% of the expected results. Therefore, if the point estimate of a statistical model of 10.00 has a confidence interval of 9.50 -10.50 95%, one can deduce that there is a 95% probability that its true value is found in that range. Statisticians often use confidence intervals to understand the statistical significance of their predictions, inferences, and estimations.
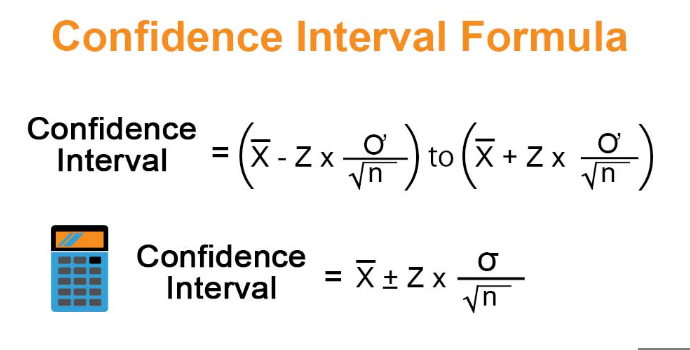
The formula for calculating the confidence interval is;
Confidence interval (CI) = ‾X ± Z*σ/√n
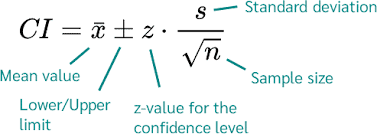
Where:
CI = the confidence interval
X̄ = the population mean
Z* = the critical value of the z distribution
σ = the population standard deviation
√n = the square root of the population size
Learn more tips and ideas about IB Math IA topics.
What is a 90 Confidence Interval?
A 90% confidence interval technically means you only have a 10% chance of being wrong. It means you will be right in the results acquired up to 90% only. To calculate this, you first calculate the standard error (SE) and margin of error (ME).
SE = σ/√n
ME = SE × Z(0.90)
You will then determine the confidence interval using ME and μ, where μ is the calculated mean.
upper bound = μ + ME
lower bound = μ – ME
What is a 95 Confidence Interval?
A 95 confidence interval means you can only be wrong by 5%. The results of the range of values is right at 95%. To calculate a 95 confidence interval, you use the above formula, where we calculated the 90 confidence interval. Add and subtract two standard deviations from your average to obtain a 95 confidence interval.
Types of Confidence Intervals
Confidence intervals can be divided into two including:
Interval estimate for a population proportion
We use this confidence interval when we want to estimate the precise proportion of a population that has a given attribute based on sample size. To calculate the interval estimate here, you use the sample size, sample proportion, and critical value of the level of confidence. This confidence interval is mainly used in public opinion polling and survey research.
Interval estimate for a population mean
It is used when we want to estimate the actual mean of a population on the data sample. Here we use the sample size, sample mean, and standard deviation of the sample to come up with the interval estimate. This confidence interval is mainly used in hypothesis testing and inferential statistics.
Explore how you can learn calculus and master the topic.
Importance of the Confidence Interval
When working with sample data in a given study, we want to be sure of the sample’s results. Confidence intervals give us the likely range of values of the population mean. However, when you calculate the mean of a given set of data, you just have one estimate of the metric. Confidence intervals, therefore, provide richer data that showcases the possible values of the true mean.
Sample size is used to calculate confidence intervals, so if you increase the sample size, expect the confidence intervals to reduce. Understand that the smaller the confidence interval, the better. When money and time are tight in any research, we rely on smaller sample sizes. We gain more information on the values we want to estimate by calculating confidence intervals. Confidence intervals, therefore, make our analysis richer and help us make informed decisions.
Finding confidence intervals may be complicated for most students. That is because it falls into the statistics subject that is a nightmare to many. However, there is hope. You can always get a qualified statistics homework helper that will handle the homework or task for you.
How to Calculate Confidence Interval
Calculating the confidence interval involves several steps. They include:
Step 1: Find sample mean
The first step is to calculate the mean. That is arrived at by adding all values in the data set and dividing by the number of values. For example, if you have a data set of 5 values, you can add all the values together and then divide the total by 5 to find the mean. Example data sets maybe 10, 14, 16, 28, and 20.
Mean = (10+14+16+28+20) / 5
Answer = 17.6
Step 2: Calculate standard deviation
The next step is finding the standard deviation. You can do that by subtracting the mean from every value and then squaring what answer you get. Then divide the final answer by the number of values. From the example above:
Standard deviation = (10 – 17.6) ² + (14 – 17.6) ² + (16 – 17.6) ² + (28 – 17.6) ² + (20 – 17.6) ² =
57.76 + 12.96 + 2.56 + 108.16 + 5.76 = 187.2
187.2/5 = 37.44
Step 3: Find the standard error
We use the standard deviation and sample mean to find the standard error. Standard error shows us how accurate our sample is in representing the population. You can arrive at standard error by dividing the standard deviation by the number of values in the sample size.
37.44/5 = 7.488
Step 4: Find margin of error
It shows the random sample errors in your data set. Having a large margin means less confidence in getting the same results in your population data set. To arrive at the margin of error, you divide the standard error by two. In our example, it will be 7.488/2 = 3.744
Step 5: Apply these results in the formula
Now that you have all the other variables and information to feed into the formula, the last step is actually working out the confidence interval formula. Work it out, assuming a confidence level of 95%.
CI = 17.6 ± 0.95(37.44 ÷ √5)
CI = 17.6 ± 0.95(37.44 ÷ 2.24)
CI = 17.6 ± 0.95(16.71)
CI = 17.6 ± 15.88
CI = 1.72, 33.48
Step 6: Interpret the results
The last step is interpreting the results. The confidence interval you arrive at can tell whether your study results have a probability of repeating in the total population of the sample. If the confidence interval is high, the results will likely match the confidence level for the whole population.
Our example above means the confidence interval should fall between 1.72 and 33.48. The average test for the study’s entire population should fall between the two values. Therefore, you are likely to achieve these results with the entire population under study.
Finding the confidence interval should not be too hard, but you have to be keen on the calculations. If you find it tricky, you can always get an expert that understands statistics perfectly to help.

Special offer! Get 20% discount on your first order. Promo code: SAVE20