Why is Statistical Significance Important?
What is Statistical Significance?
Statistical significance is a metric used to assess whether a data set’s apparent effects or relationships between variables are more likely the result of chance than real population differences. A lower p-value denotes a higher level of statistical significance, which is commonly, assessed using a p-value. Statistical significance serves as evidence for the accuracy of a particular statistic. Sample size and effect size make up its two main parts.
Elevate Your Writing with Our Free Writing Tools!
Did you know that we provide a free essay and speech generator, plagiarism checker, summarizer, paraphraser, and other writing tools for free?
Access Free Writing ToolsIf you have attained a particular level of confidence in the result, you can use statistical hypothesis testing to determine whether a data set’s outcome is statistically significant. To analyze experiment results and draw conclusions from data, a solid understanding of statistical significance is necessary.
Are you feeling overwhelmed and struggling to solve complex concepts and data analysis and wondering where you can get quality help with statistics homework? Worry no more. Gudwriter is your number one choice for all your statistics assignments. We have a team of experienced experts ready to solve all your statistics solutions including statistical significance tests, hypothesis testing, regression analysis and many more. Reach out to us today and guarantee yourself quality solutions that will get you A+ grades.
Types of Statistical Significance Tests
Statistical significance tests are a crucial tool for researchers to assess the likelihood that a result was obtained by chance. These tests are frequently utilized in a variety of industries, including business, healthcare, social science, and science. Statistical significance tests come in a variety of forms, each of which is intended to answer a particular research topic or set of hypotheses. We will talk about the most popular kinds of statistical significance tests in this article.
- T-Test
One of the most used statistical significance tests is the t-test. It is applied to assess if two sets of data differ significantly from one another. When the sample size is small and the population standard deviation is unknown, the t-test is appropriate. The independent samples t-test and the paired samples t-test are the two different types of t-tests.
To compare the means of two independent groups, use the independent samples t-test. On the other hand, the paired samples t-test is utilized to compare the means of two related groups, such as before and after measurement.
- Anova
The statistical significance test known as Analysis of Variance (ANOVA) is used to compare the means of three or more groups. The means of the groups are compared using an ANOVA to see if there is a significant difference or if the differences are just coincidences. ANOVA can be applied to both continuous and categorical data and can be employed with either a balanced or an unbalanced design.
- Chi-Square Test
If there is a significant difference between the observed frequencies and the expected frequencies in a contingency table, the chi-square test is a statistical significance test that may be performed to assess this. It is possible to utilize the chi-square test for two-way and multi-way tables when dealing with categorical data.
- Correlation Test
Correlation test can be used to prove if there is a significant relationship between two continuous variables. The correlation test evaluates how strongly and in what direction the two variables are related. The correlation test that is most frequently employed is the Pearson correlation coefficient.
- Regression Analysis
The link between a dependent variable and one or more independent variables can be ascertained using regression analysis, a statistical significance test. Both linear and nonlinear relationships can be modeled using regression analysis, which is used to determine the relationship between the variables.
- Mann-Whitney U Test
A nonparametric statistical significance test called the Mann-Whitney U test can be used to examine whether the medians of two independent groups differ significantly from one another. When the data are not normally distributed, we utilize the Mann-Whitney U test. Explore how you can learn calculus and master the topic.
Why is Statistical Significance Important?
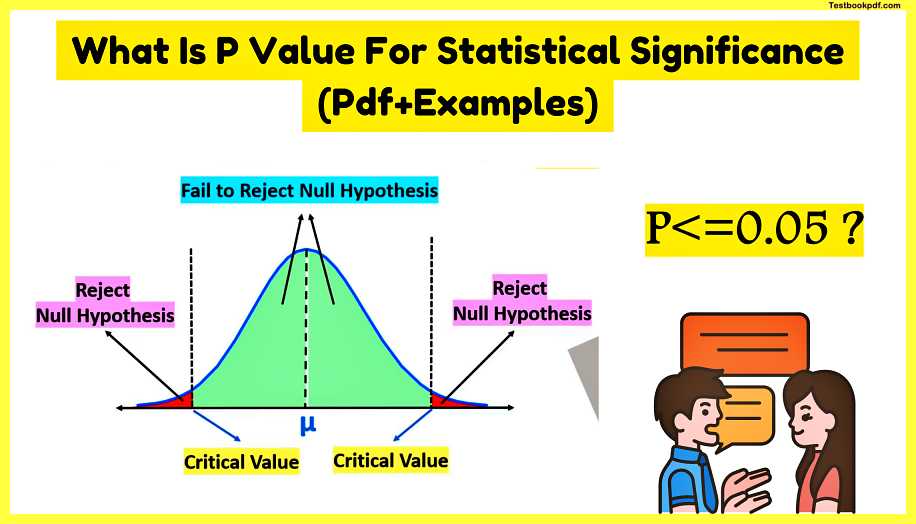
Statistical significance is a key idea in scientific study and is extremely important in establishing the reliability of the results. The degree to which a study’s findings are unlikely to be the result of chance or random mistake is essentially what is meant by statistical significance. Typically, a study’s significance threshold is established at a p-value of 0.05 or lower, which indicates that there is only a 5% possibility that the findings might have been the result of chance.
The value of statistical significance is found in its capacity to support the reliability of research findings. A study’s findings that is statistically significant indicate that they are more likely to reflect reality than chance alone. Researchers can then use the data to derive reliable inferences and make defensible decisions.
Additionally, statistical significance is essential for guiding researchers away from drawing erroneous inferences or generalizations from random or inconsequential data. Without statistical significance, researchers would be driven to make inexplicable inferences, which could produce faulty or wrong results.
How to Calculate Statistical Significance
Here are the steps for calculating statistical significance.
- Create a null hypothesis
Establishing your null hypothesis is the first step in the statistical significance calculation process. There should not be a discernible difference between the data sets you’re utilizing, according to your null hypothesis. Remember that you are not required to accept the null hypothesis.
- Create an alternative hypothesis
In this step, you choose an alternative hypothesis, which should be the opposite of your null hypothesis because it will show a statistically significant relationship between your data sets.
- Determine the significance level.
The next step for you is to figure out the alpha, or significance level. The likelihood of rejecting the null hypothesis even when it is correct is what is meant by this. 0.005, or alpha, is a typical value.
- Decide on the type of test you’ll use
You then choose between a one-tailed test and a two-tailed test. In a two-tailed test, the critical region of distribution is two-sided as opposed to one-sided in a one-tailed test. To put it another way, one-tailed tests examine the link between two variables in a single direction, whereas two-tailed tests examine the relationship in both directions. The alternative hypothesis is accepted as true if your sample falls within the one-sided critical area.
- Perform a power analysis to find out your sample size
The size of your sample will then need to be determined via a power analysis. The effect size, sample size, level of significance, and statistical power are all factors in a power analysis. Consider using a calculator for this step. With this kind of analysis, you can examine the sample size required to identify the outcome of a particular test with a certain level of confidence. In other words, it will inform you of the appropriate sample size for determining statistical significance. For instance, if your sample size turns out to be too tiny, your findings will not be reliable.
- Calculate the standard deviation
Use the formula below to calculate the standard deviation.
standard deviation = √((∑|x−μ|^ 2) / (N-1))
where:
∑ = the sum of the data
x = individual data
μ = the data’s mean for each group
N = the total sample
By performing this computation, you may determine how widely to distribute your measurements in relation to the mean or expected value. The variance between the sample groups must be calculated if you have more than one sample group.
- Use the standard error formula
You must then apply the usual error formula. Let us assume for the purposes of this discussion that your two groups have two standard deviations. The following is the standard error formula.
Standard error = √((s1/N1) + (s2/N2))
where:
s1 = the standard deviation of your first group
N1 = group one’s sample size
s2 = the standard deviation of your second group
N2 = group two’s sample size
- Determine t-score
In this step you need to find the t-score and the equation is as follows;
t = ((µ1–µ2) / (sd))
where:
t = the t-score
µ1 = group one’s average
µ2 = group two’s average
sd = standard error
- Find the degrees of freedom
You use the following formula to find the degree of freedom.
degrees of freedom = (s1 + s2) – 2
where:
s1 = samples of group 1
s2 = samples of group 2
- Use a t-table
Thisis the last step of calculating statistical significance. The statistical significance will then be determined using a t-table. Find your variance by starting with the left side of your degrees of freedom. After that, look up to see the p-values. Compare the p-value to the alpha, or the significance threshold. Keep in mind that a p-value of 0.05 or below is regarded as statistically significant.
Get to understand what is confidence interval and how to calculate it.
Statistical Significance Example Problem
We are investigating two advertising strategies, A and B on sales. The main objective of the study is to determine if there is a difference in the advertising strategies used. A sample of 42 sales using strategy A resulted to a mean sales of $215 with a standard deviation of 12. A sample of 40 sales using strategy B resulted in a mean of $207.89 with a standard deviation of 6. Determine if there is a significant difference in the advertising strategies used in the study?
Step 1: State the null and alternative hypothesis.
H0: There is no significant difference between the advertising strategies used
H1: There is a significant difference in the advertising strategies used.
Step 2: Determine the level of significance.
We use a 5% level of significance in the study.
Step 3: Determine the type of test to use.
Since we are interested in finding the difference between the two advertising strategies, we use a two-tailed test. We claim that there might be a difference in advertising strategies employed in the study.
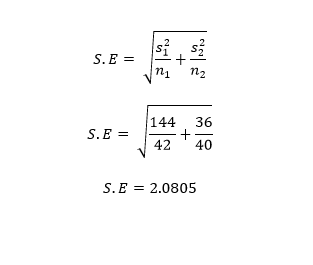
Step 4: Compute the standard error.
The population in the study is not assumed to have equal variance, we, therefore, do not use the pooled variance but rather compute the standard error to use in the computation of t-score.
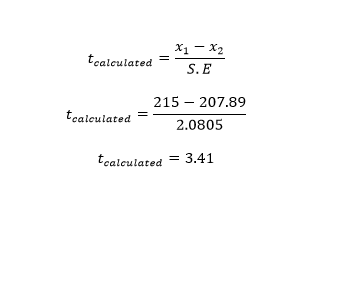
Step 5: Compute the test statistic.
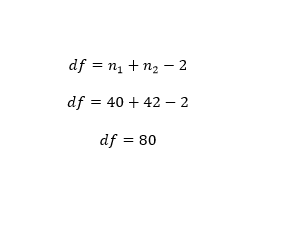
Step 6: Compute the df to use.
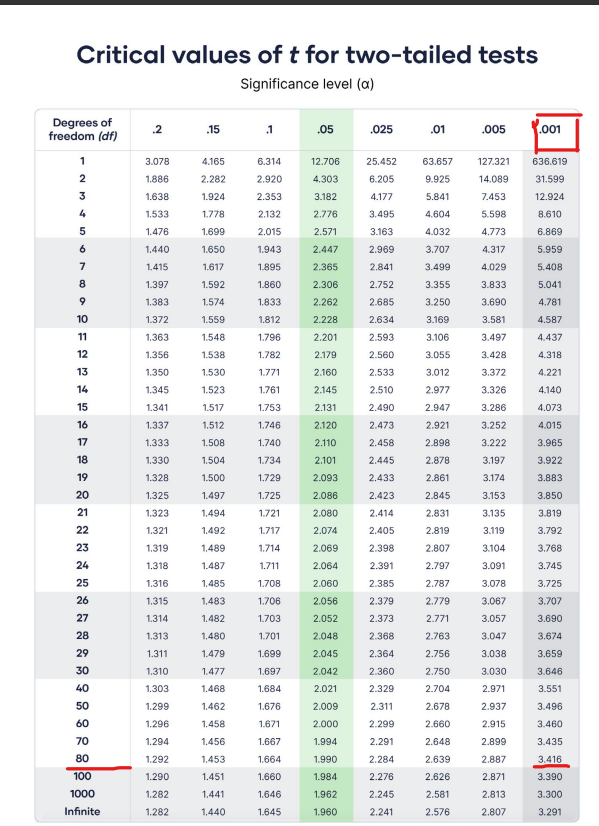
Step 7: Read p-value from the student t-tables.
From the statistical table, find the row corresponding to the degrees of freedom used. Inside the table, find t-score value, and look up the column head to find the level of significance.
The p-value therefore for the test above is 0.001.
Explore tips and ideas on IB Math IA topics.
Problems with Relying on Statistical Significance
In research and data analysis, the concept of statistical significance is frequently used. It refers to the probability that a result is the consequence of a true effect rather than a random event. Yet, depending too much on statistical significance might result in a number of issues such as;
- Overemphasis on P-values
P-values are a metric for statistical significance; a lower number denotes more compelling evidence that the null hypothesis is false. Statistical significance is frequently measured using a cutoff of 0.05, according to researchers. This, however, might cause effect sizes to be neglected in favor of P-values. A significant finding does not always imply that the effect size is considerable.
- Publication Bias
Studies having substantial outcomes are more likely to be published by researchers than those without. As a result, the literature may exaggerate the actual effect magnitude, which is known as publication bias. In disciplines like psychology and the social sciences, where minor impacts are frequent, this might be an issue.
- Replicability Crisis
The phenomenon of many scientific researches being impossible to duplicate is known as the replicability crisis. The overuse of statistical significance is one factor contributing to this. In order to find a significant result, researchers may participate in p hacking, which involves manipulating the data. As a result, there may be significant but false positive results or false positives.
- Context Matters
Data analysis frequently employs statistical significance as a one-size-fits-all methodology. But context is important. A significant finding in one study that used a different sample or research strategy might not be significant in another. Effect sizes, practical significance, and the broader context of the study issue should all be taken into account by researchers.

Special offer! Get 20% discount on your first order. Promo code: SAVE20